Granting Stock Options: How Do Accounting Values Compare Against “In-the-Money” Values?

Introduction
Our research shows that the grant date accounting value (e.g., Black-Scholes value) is significantly lower than the future in-the-money value of most stock options. This is a unique topic of research in the executive compensation field.
Stock option accounting rules require companies to determine the fair value of stock-based compensation awards at the date of grant, which are significant and irreversible. This requires an option-pricing model, such as the Black-Scholes-Merton (Black-Scholes) model or a lattice (Binomial) model, that factors the exercise price, stock price volatility, expected term, dividend yield, and risk-free interest rate at the time of grant to estimate an economic value of the award.
However, this accounting value differs significantly from the in-the-money value of options, which is zero at the time of grant. This can be confusing to Compensation Committees, HR leaders, and recipients, as the grants are set and disclosed in the proxy’s Summary Compensation Table at their accounting value. In some cases, option awards expire without ever being in-the-money. However, in most cases, option grants are exercised after vesting at a higher stock price, which can yield greater in-the-money value than the accounting value.
This Viewpoint takes a deeper dive into this differential of accounting versus in-the-money values.
Analysis
To quantify the potential differential between the accounting versus in-the-money value, we compared:
- The grant date accounting value to
- The future in-the-money value assuming an option is exercised at the expected term date, discounted to present value
This consistent time frame was used across all option grants analyzed to ensure comparability among companies, although actual timing and stock prices chosen by the executive differ from the expected term used for our study. A sample calculation is shown below for illustrative purposes:
- Company A granted an option in 2010 with a current stock price of $10, with an accounting value of $4.50 (45%) and expected term of 5 years.
- The stock price 5 years later (the expected term used in the grant date fair value), in 2015, is $25; the in-the-money value of the option is $15 ($25-$10), with a present value of $10.21 (8% cost of equity rate of return discounted for 5 years).
- In this case, the accounting value is significantly below the in-the-money value by $5.71 ($10.21-$4.50), i.e., the in-the-money value is 227% of the accounting value ($10.21/$4.50).
Our data set includes all option grants for S&P 500 index constituents as of January 1, 2010, and covers 10 years’ worth of grants (2010 to 2019)[1] that meet the following disclosure conditions: the accounting value and assumptions used in the valuation were disclosed, for a total of 2,159 data points. Table 1 summarizes the ratio of the in-the-money present value to the accounting value:
- A ratio of 200% indicates that the in-the-money present value of the option award was double that of the accounting value.
- A ratio of 100% indicates the in-the-money present value of the option award was equal to the accounting value.
- A ratio of 0% indicates the in-the-money present value was $0, as it was underwater.
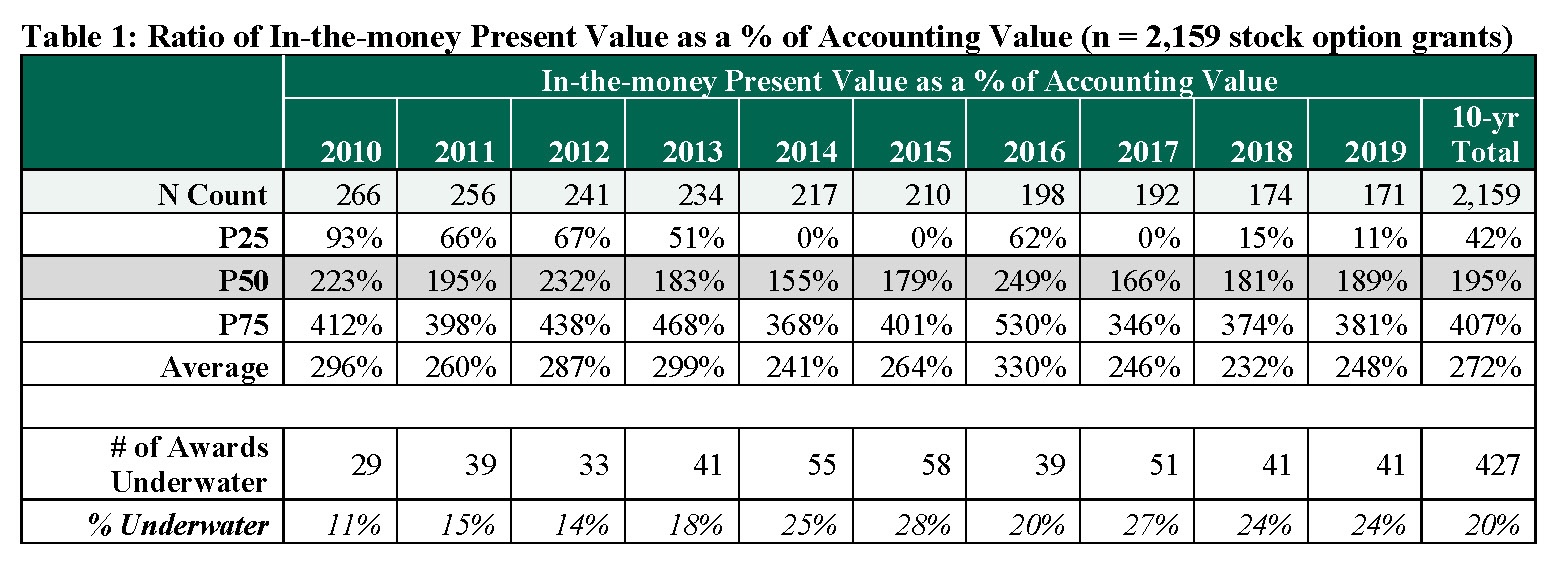
Table 1 contains robust data that shows:
- Our primary finding: Around 65% of the options (1,409) end up with an in-the-money present value that is above the accounting value.
o These statistics indicate that the present value of the in-the-money amounts are consistently and materially above the accounting values as of the expected term date.
o The median ratio of in-the-money present value to accounting value for each of the 10 years ranges from 155% to 249%, with a total sample median for all 10 years of 195%. - Across the total sample, 20% (427) of option awards are underwater as of the expected term date.
- An additional 15% (323) are in-the-money but below the accounting value.
When companies grant stock options, they typically utilize the accounting value to calculate a number of options that would be equivalent to a grant of a full-value award, such as a time-based restricted stock unit (RSU). For example, if the accounting value of an option was $5 versus the stock price of $20, the company would grant four options compared to one full value award. This creates more leverage in potential values, which has yielded significant value for many organizations as the S&P 500 has grown ~600%, a compound annual growth rate of ~14% over the 2010-to-2024 time period covered in the analysis. However, there is still a population of companies where such leverage has not paid off with the option being underwater and having zero value while an RSU would have kept some value.
In addition, our analysis yielded several other interesting observations:
- Health Care and Information Technology companies had the highest ratios of in-the-money present value to accounting value, with a median of 265% and 247%, respectively, over the 10-year time period. This indicates a strong and sustained appreciation in equity values post-grant.
o For Information Technology companies, these high ratios are in spite of the highest accounting valuations in the group — median accounting value is 30% as a percentage of market value at the time of grant over the 10-year time period compared to a median of 24% for the total sample. - Consumer Discretionary and Materials companies had the lowest ratios of in-the-money present value to accounting value, with a median of 133% and 158%, respectively, over the 10-year time period. This suggests slower equity growth and sector-specific headwinds.
- Approximately half of companies have had all of their option grants over the 10-year period be in-the-money at the time of the expected term; conversely, approximately 20% of companies have had more than half their option grants be out-of-the-money.
Conclusion
Our analysis shows that the in-the-money present value is higher than the accounting value for the majority of option awards. It is important for Compensation Committee members, HR leaders, and award recipients to understand the difference and purpose of the two values. It also highlights the need for appropriate communications and education around various incentive vehicles, as options have a unique reward profile that our data shows have potentially significant value over longer periods of time and comes with unique financial planning flexibility. Further studies will investigate stock option values granted during down years, e.g., COVID.