Environmental Performance Metrics in Incentive Plans: Incentive Trends and Key Design Considerations

Introduction
In recent years, global companies have grappled with defining a baseline for environmental metrics, establishing the processes and controls to measure and report progress toward objectives, and setting the goals of ambitious environmental performance metrics (especially if environmental performance metrics are used in executive incentive arrangements). Institutional investors have also been increasingly seeking ways to ensure that the companies in which they invest are actively working towards a sustainable future. In response to these investors pushing for progress on sustainability (among other priorities), the majority of S&P 500 companies have released sustainability reports, and boards of directors, compensation committees, and management teams have been discussing whether a portion of executives’ incentive compensation programs should be tied to corporate sustainability priorities.
From setting greenhouse gas (GHG) emissions reduction targets to promoting circular economy practices (which involve minimizing waste and maximizing the reuse and recycling of resources), some compensation committees have considered if there are specific and actionable performance metrics that should be included in executive incentive plans. Whether environmental incentive metrics will support meaningful sustainability progress depends on how the metrics are created, measured, and evaluated.
In this article, we explore the role “E” in Environmental, Social, and Governance (ESG) priorities has played in executive incentive arrangements, as well as design considerations for including an “E” metric in executive incentive plans.
Heightened Pressure for Environmental Action
The "E" in ESG encompasses a wide range of factors that, in some cases, may have implications for how external stakeholders view a company's long-term sustainability. These “E” factors include a company's energy use, GHG emissions, waste management, water use, resource conservation, and biodiversity impact, among other factors. By considering these factors, investors and other key stakeholders can better understand a company's environmental footprint and assess the potential risks and opportunities that may arise from its sustainability practices.

To date, recent regulations in the U.S. and European Union (EU) are making environmental-related disclosures a compliance requirement, which adds pressure for companies to demonstrate their commitment to sustainability and climate resilience. Such legislation includes:
- European Parliament and Council of the EU approving the Corporate Sustainability Reporting Directive in December 2022 (effective January 2024), which requires EU businesses and qualifying EU subsidiaries of non-EU companies to disclose their environmental and social impacts as well as how their ESG actions affect their businesses.
- State of California’s Governor Newsom approving (in October 2023):
— SB-253 which requires the California Air Resources Board to develop and adopt regulations requiring businesses with total revenues over $1 billion and operating in California to disclose their GHG emissions to an emissions reporting organization, and
— SB-261 which requires reporting on companies’ climate-related financial risks for California companies with total annual revenues over $500 million.
- SEC issuing Rule No. 33-11275 The Enhancement and Standardization of Climate-Related Disclosures for Investors (in March 2024), requiring public issuers to disclose climate-related information in their annual reports and registration filings. Such information includes material climate-related risks; activities to mitigate or adapt to such risks; information about the registrant's board of directors' oversight of climate-related risks and management’s role in managing material climate-related risks; information on any climate-related targets or goals that are material to the registrant's business, results of operations, or financial condition; Scope 1 and/or Scope 2 GHG emissions on a phased-in basis by certain larger registrants when those emissions are material; the filing of an attestation report covering the required disclosure of such registrants’ Scope 1 and/or Scope 2 emissions, also on a phased-in basis; and disclosure of the financial statement effects of severe weather events and other natural conditions (e.g., costs and losses).
In addition to approved U.S. legislation within the last 12 months, we observed a 31% year over year increase in the number of 2023 environmental shareholder proposals [1] received by Russell 3000 companies with the three most common proposals related to GHG emissions, reports on climate change, and financial support/lending for fossil fuel development/exploration. The average shareholder support for the 2023 proposals was 21%, with two proposals receiving majority shareholder support (one Energy company and one Financial Services company).
E” Metrics in Executive Incentive Plans Among S&P 500 Companies
Prevalence and Types of Environmental Metrics in Incentive Plans
Based on Pay Governance’s review of the use of environmental performance metrics in executive incentive plans among S&P 500 companies, [2] approximately 32% (n=159) include an “E” performance metric in their incentive plans, with the most common metric being related to Carbon Footprint and Emission (43%). See Figure 2 for the prevalence of all types of metrics identified in incentive plans.


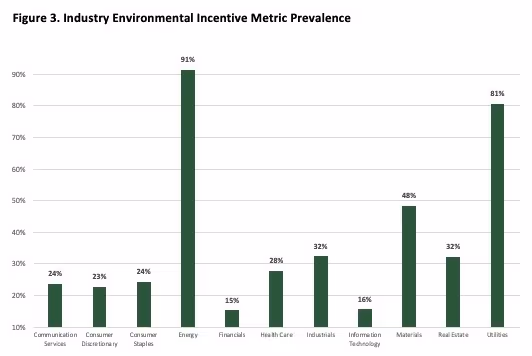
Among the S&P 500, there is significant variation of the prevalence and type of “E” incentive performance metric by industry. To no surprise, Energy (91%) and Utility (81%) companies have the highest prevalence of “E” metrics in their executive incentive plans. Among other industries, prevalence generally is under 50%, with Materials companies at 48% and Industrials and Real Estate companies both at 32% when incorporating an “E” metric in their incentive plans. Financial Services and Information Technology companies were the only industries with “E” incentive metric prevalence below 20% (15% and 16%, respectively). See Figure 3 for a detailed breakdown by industry.
Regardless of industry, Carbon Footprint and Emission is the most common type of “E” incentive performance metric found in plans. This may be
attributable to new U.S. and EU regulatory mandates, which generally require the transparent disclosure of Scope 1, 2, and 3 emissions. In connection with this regulatory shift is a push from some environmentally focused investors looking for “low carbon bargains” — investments offering reduced carbon footprint per revenue.
Additionally, some investors view their financial allocations as extensions of their personal values. These investors are not only driven by financial returns but also by the desire to align their portfolios with their view of an environmentally responsible narrative. If these investors increase in prevalence or investment, the incentivization of senior leadership to fulfill these emerging requirements may become more prevalent across industries.
Generally, the second most common type of “E” performance metric in incentive plans across all industries is related to the area of Energy, with the exception of Consumer Discretionary and Consumer Staples companies.
Energy is a common performance metric, particularly for companies that consume large amounts of electricity, fuel, and natural gas for key operations. Energy consumption directly impacts a company’s GHG profile and can represent a significant operating expense. Executives in energy-intensive industries can enhance corporate value by improving efficiency, thereby reducing operational costs, mitigating risks associated with fluctuating energy prices and peak demand charges, and achieving carbon reductions that support corporate sustainability goals.
Among Consumer Staples companies, Waste-related incentive performance metrics are the second most common type of metric utilized, while Waste- and Water-related metrics were the second most common metrics among Consumer Discretionary companies. Historically, waste and
recycling dominated the landscape of company environmental priorities, reflecting their popularity in environmental discourse and the ability for every employee to make an impact. However, recent revelations and growing public awareness have cast shadows of skepticism on recycling practices, particularly around plastics. Observations suggest a growing awareness among consumers regarding the complexities and challenges associated with recycling claims, which may be perceived as overstated or not fully transparent. This shifting perception appears to influence the role of waste and recycling as key metrics in environmental reporting. Similarly, the focus on carbon offsets and market-based carbon reductions is evolving, with increased attention being paid to their effectiveness and transparency. In response to these shifting perspectives and the broader environmental context, businesses are considering adjustments and enhancements to their reporting frameworks to better align with dynamic consumer expectations and environmental needs. See Figure 4 for a summary of the types of “E” incentive performance metrics utilized by industry.
How companies measure and define the types of environmental metrics varies widely across industries, in part due to the lack of standardization around reporting these metrics. However, we are beginning to see increased consistency in the disclosure of carbon emissions metrics and targets in line with new regulatory requirements.

Types of Incentive Plans Where “E” Metrics Appear
ESG metrics, including environmental metrics, are more commonly found in annual incentive plans than in long-term incentive (LTI) plans in the U.S. Among the S&P 500 companies that include environmental metrics in their incentive plan
design, only 12% include an environmental metric in their LTI design. Of the companies that have included “E” metrics in their LTI design, 47% are in Energy and Utility, 26% are in Consumer Discretionary and Consumer Staples, 12% are in Health Care, 9% are in Materials, and the other 6% are made up of Information Technology and Financial Services companies.
How the Measurement of an “E” Performance Metric is Structured in Incentive Plans
When it comes to the structure used to evaluate “E” performance metrics in incentive plans, 75% of companies utilize a Strategic Scorecard and 25% use a Carve-Out (i.e., stand-alone metric with defined weighting) approach to determine how the metrics will impact the incentive payout.

With respect to the disclosure provided to shareholders on the approach used to assess performance and corresponding incentive payout, the majority of companies do not disclose detailed information about the “E” metric and/or corresponding goals and incentive payout. However, 33% of companies disclosed using a formulaic approach whereby threshold, target, and maximum goals were established and disclosed along with the corresponding payout opportunities.
We also observed 22% of companies with an “E” performance metric incorporating the “E” metric as a modifier, whereby the final incentive payout is adjusted upward and/or downward based on the achievements of the metric. For companies that have a modifier that allows for both upward and downward adjustments in the final payout (majority practice), the modifier range is +/- 5% to 20%, with a 10% modifier being the average. For companies that only apply a downward adjustment in the final payout (minority practice), the modifier range is 10% to 15% and a 10% modifier is the mode. See Figure 5 for the prevalence of how modifiers are used to determine the final incentive payout.

A Guide to Identifying “E” Metrics
For companies considering the inclusion of “E” performance metrics in their incentive plan, they first might want to align planning with the company’s environmental priorities and determine the environmental readiness in the measurability/ quantification of objectives. Four factors that generally influence the development of overall corporate environmental goals include:
1. Materiality Assessment: A materiality assessment helps companies determine the areas where addressing environmental and social impacts can have the most significant positive business impact. By identifying the most material issues, businesses can focus on areas that provide the greatest practical value to both their bottom line and the environment, minimizing threats and maximizing opportunities.
2. Internal Objectives: Companies should set and review internal goals that drive environmental performance and support stakeholder requirements. For example, companies setting internal environmental impact reduction targets, and choosing vendors that report carbon, water, and waste metrics can help companies reduce risk and meet stakeholder expectations. Additionally, pursuing environmental initiatives presents branding opportunities that can boost a company's reputation and demonstrate commitment to sustainability.
3. Compliance with Recognized Frameworks: If a stakeholder or internal preference requires compliance with specific frameworks, such as the Carbon Disclosure Project or the Science-Based Targets initiative (SBTi), companies should consider the metrics required by those frameworks when defining their own. Organizations must navigate these frameworks and select the most relevant metrics to incorporate into their environmental strategies and executive compensation plans.
4. External Influences: Companies should consider the metrics and requirements of their stakeholders — such as investors, regulators, and customers. For instance, if stakeholders require tracking of scope 1, 2, and 3 emissions, companies must establish mechanisms for monitoring and reporting these figures.
Together, the factors above can help define what a company should monitor and target for environmental improvements.
When setting environmental goals, businesses typically follow several approaches to ensure their objectives are both ambitious and achievable. Two standard methods for defining environmental goals are absolute targets and intensity metrics:
- Intensity metrics look at environmental impacts in relation to a relevant denominator, such as emissions per dollar of revenue or energy consumption per production unit. This approach allows companies to track their environmental performance in the context of their business growth and can help identify areas where efficiency improvements can be made.
- Absolute targetsinvolve setting a specific percentage reduction in emissions or resource consumption by a defined date. For example, a company may commit to reducing its GHG emissions by 30% by 2030. This approach allows for clear, quantifiable goals that can be easily tracked and communicated to stakeholders.
The SEC guidelines recommend that companies report both absolute and intensity metrics, which can provide a more comprehensive understanding of a company's environmental performance.
Based on a review of proxy disclosures, companies that disclosed their climate-related goals (generally a minority of companies) most commonly reported absolute metrics since they present a single, straightforward number that is easy to explain. Absolute metrics typically capture the entirety of a specific environmental impact, such as total GHG emissions, without adjusting for the company's size or operational scale. The primary goal of these metrics is to track and ideally reduce the overall impact number, signifying a move towards a more sustainable operation.
Intensity metrics offer a nuanced perspective that facilitates comparison across diverse business models and scales. They allow stakeholders to essentially compare "apples to oranges". Among the various intensity metrics available, revenue-based intensity metrics are most frequently used. By relating environmental impact to revenue, this metric provides outside observers with insights into the environmental cost or "carbon cost" associated with every dollar earned. This holds true irrespective of the nature, product, or service of the company.
Frameworks like the SBTi mainly allow targets based on absolute metrics. However, intensity targets for Scope 1 and Scope 2 emissions may be more appropriate to include when they are modeled using an approved 1.5°C sector pathway (consistent with the 2015 Paris Agreement) applicable to companies’ business activities. This approach ensures that businesses consistently focus on their environmental performance and fosters a sense of urgency in achieving their targets.
In our experience, institutional investors and proxy advisors prefer executive incentive designs that are measurable and transparent. This includes clearly detailing the performance metrics and goals used to reward executives (See Figure 6 for an example disclosure). Therefore, when it comes to incorporating “E” performance metrics in incentive arrangements, quantitative metrics (i.e., pre-defined goals are set at the beginning of the performance period and achievement against the goal at the end of the performance period determines a corresponding incentive payout) are often preferable. Additionally, as companies’ environmental reporting capabilities become more robust and automated, this may further lend itself to companies considering whether quantitative “E” performance metrics should be included in their executive incentive designs.

While quantitative metrics are generally preferred, there are situations where qualitative metrics may be more relevant. Early-stage companies at the outset of their sustainability endeavors — such as those undertaking materiality assessments, instituting sustainability teams, or identifying internal benchmarks — require a degree of flexibility. In a company’s early stages, while it's permissible to express goals qualitatively, a natural progression often results in these companies shifting towards more quantitative measures as their strategies mature. Even well-established companies with robust environmental strategies occasionally find qualitative metrics beneficial, particularly when taking their initiatives to the next level. For example, a company with a mature GHG metric may use qualitative metrics before eventually crystallizing into more quantitative goals. Irrespective of where a company stands on its sustainability journey — be it in the nascent stages or further along — qualitative metrics serve as a valuable approach to illuminate a company's commitment and progression.
See Figure 7 for more information on best practices for setting climate compensation metrics.

Incorporating “E” Performance Metrics in Incentive Plans
Once a decision has been made to include an “E” performance metric in the executive incentive plan, as well as the approach used to measure outcomes (quantitative or qualitative), the company will need to determine the following incentive design considerations:

Conclusion
As the external focus on environmental objectives and outcomes grows in the future, we believe companies will continue to assess the value and importance of linking a portion of executive incentive plans to environmental priorities. Incorporating the fundamental factors described throughout this article into a company's environmental incentive design goal-setting process can help ensure that objectives are clear with reasonable metric parameters. Additionally, by setting absolute targets, intensity metrics, and both interim and longer-term goals, organizations can effectively monitor their environmental performance and make meaningful progress toward a sustainable future. For companies that decide to align executive incentives programs with well-defined goals that are reasonable and clear to shareholders, this can further demonstrate the importance of environmental priorities (among other financial and operational goals) and help external stakeholders understand that an “E” performance metric in an incentive plan is not merely “window dressing”.
[1] Data are compiled from ISS Corporate Solutions’ Voting Analytics as of December 31, 2023.
[2] Research was based on information disclosed in ESGAUGE’s incentive database and Pay Governance’s review of S&P 500 proxy filings in 2023.